Browse through our Journals...
Optimum bed occupancy in psychiatric hospitals
Dr Rod Jones (ACMA, CGMA)
Statistical Advisor
Healthcare Analysis & Forecasting
Camberley, UK
www.hcaf.biz
Abstract
The role of occupancy in the functioning of psychiatric hospitals is poorly understood. Occupancy is explained both as a measure of busyness and using the Erlang equation to link number of beds with average occupancy and turn-away, i.e. the proportion of times a bed is not available for the next arriving patient. From the perspective of the patient it is the turn-away (or bed unavailability) that is the key metric while from the perspective of staff occupancy levels above 80% lead to stressful working environments. From the perspective of the community-based mental health services the availability of free beds in their local psychiatric hospital represent the necessary relief valve to maintain an efficient community service. A figure around 3% to 5% turn-away is suggested to be somewhere near to the optimum balance between access and cost of capital and this implies a range of occupancies depending on the size of the facility. This suggests that all psychiatric hospitals with fewer than 100 beds should be operating below 85% average occupancy while larger hospitals should be limited to a maximum of 85% occupancy in order to protect both patients and staff from untoward incidents arising from busyness.
Introduction
There is considerable debate as to the optimum number of psychiatric beds and bed occupancy (1-6) and the adverse effects of overcrowding on violence toward staff (7). Historically the 85% occupancy figure seems to have been developed around 1975 in the USA as a Federal target for hospital beds in general, although at 85% average occupancy some 40% of maternity units and 90% of intensive care units have insufficient capacity to provide a bed for the next arriving patient (8). In more recent times the 85% occupancy figure re-appeared as a misunderstanding of the study of Bagust et al (6). Their observation that queues began to form at around 85% average occupancy was taken out of context since their study referred to a single specialty bed pool containing 200 beds and not to whole hospital occupancy (6,9). Hence to understand what is happening from a patient’s perspective we need to understand the link between size, occupancy and queuing.
This article will give an overview of hospital occupancy in general and the factors which determine the ‘optimum’ occupancy in psychiatric and other mental health hospitals. In particular it will attempt to bridge the gap between purely mathematical approaches and the human behaviour aspects of overcrowding.
Occupancy Explained
A figure of 85% occupancy is often quoted as ‘good practice’ in mental health (4) and other health care contexts (8). From a human behaviour perspective the figure of 85% is probably best understood as equivalent to an index of busyness. This is analogous to the red line on an engine tachometer. To avoid damage you can run the engine near to the red line for short periods of time, however the optimum mechanical efficiency will usually be much lower than the red line. Using this illustration we can understand why many studies have shown that above 85% occupancy all measures of (acute and psychiatric) hospital performance rapidly deteriorate, be it hospital acquired infection rates, staff dissatisfaction, burn-out and use of anti-depressants, errors, excess deaths, serious incidents causing major or extreme harm, queues and aggressive behaviour by patients (7, 10-20). In this context 85% average occupancy becomes an upper limit for damage limitation rather than an optimum figure.
Indeed in an acute hospital context several authors have concluded that the general increase in hospital acquired infection (HAI) as occupancy increases is primarily a hygiene issue and in theory very high occupancy could be sustained if hygiene standards did not decline (17,21). However, it would appear that the level of busyness, a by-product of high occupancy, leads to declining adherence to standards in general (including hygiene), and hence HAI is indirectly linked with occupancy levels.
It has been suggested that the same reasoning applies in maternity units where the periods of relative quiet are necessary to give everyone the chance to recharge, catch up on paperwork and ensure the department is functioning as it should (21). It was suggested that, based on this reasoning, the maximum size for a maternity unit could be as small as 10,000 births per annum, i.e. 75 beds at 55% average occupancy. This assertion may prove to be too conservative, however, it suggests that further study is required regarding the human aspects of ‘optimum’ occupancy and how staff could be better supported to work effectively at higher average occupancy levels.
A recent study into the adverse effects of high occupancy has demonstrated that in a large acute teaching hospital with 650 beds the probability of severe adverse events, i.e. an in-hospital fall resulting in a fracture or an overdose of medication requiring treatment or a longer stay to rectify, increased significantly above 75% occupancy (actual occupancy on the day rather than an average occupancy figure). Half of all falls resulting in a fracture occurred above 99% occupancy and half of medication events occurred above 98% occupancy. Occupancy was measured on a daily basis (20). At this hospital the probability of at least one severe event per day was 15%, 20% and 28% at 80%, 90% and 100% occupancy respectively (20). While these results were from an acute hospital their wider applicability to a mental health context should be readily apparent.
Having presented occupancy from the viewpoint of busyness and stress arising from working at prolonged levels of busyness we can now turn to a more mathematical view of optimum occupancy.
Occupancy Modelled
It will be appreciated that as the average occupancy increases, queues will form to access a bed since the immediate occupancy will occasionally be 100%, i.e. the average is derived from a distribution of high and low immediate occupancies. A branch of mathematics known as queuing theory (the Erlang equation) sheds light on the relationship between size (number of beds), average occupancy and the number of times a bed is not available for the next arriving patient (9, 23-28). Indeed in 1987 a paper described how to use the Erlang equation to determine the number of psychiatric beds within the context of the associated queues to admission (25). While Erlang is an approximation of the real world, the fact is that it remains a good approximation (27-28) and it is the only way to calculate the link between the size of a bed pool and the likely turn-away at different average occupancies. In this context a ‘bed pool’ refers to a group of beds which are dedicated to the treatment of a particular type of patient.
Figure 1: Average occupancy and turn-away
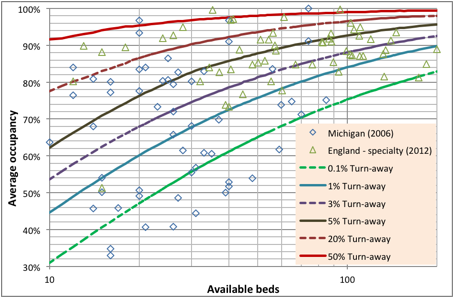
Footnote: Data for Michigan in 2006 is from http://www.michigan.gov/documents/mdch/Psych_Adult_196834_7.pdf while data from the second quarter of 2012/13 for England is from http://transparency.dh.gov.uk/?p=19745
These issues are illustrated in Figure 1 using annual average occupancy data for adult mental health institutions from the State of Michigan in the USA for 2006 and in England for 2012. Both data sets have their limitations. The Michigan data contains no split for different patient types and is therefore whole-hospital occupancy; however the occupancy figures are at the level of individual hospitals rather than average occupancy derived for groups of hospitals under single ownership. The data from England has been adjusted to the average bed pool size at specialty level but, on some occasions, contains aggregates of hospitals belonging to National Health Service (NHS) Trusts where the total bed numbers can be over multiple sites.
With these potential limitations in mind lines of turn-away have been calculated from the Erlang equation (9,26). Turn-away is the percentage of time that a bed will be unavailable for the next arriving patient who must either wait for admission or go elsewhere (if immediate admission is a priority). Note the huge disparity in bed provision between different locations in the same state or country indicating the general difficulty of exactly matching inpatient capacity and the arriving demand for an inpatient bed. However the key point is that in terms of equal access to a bed 85% average occupancy only has relevance within a context of the number of available beds and the consequent turn-away.
Figure 2: Cumulative proportion of hospitals by turn-away band
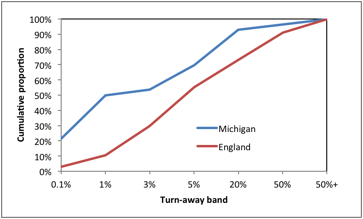
Footnote: Each turn away-band is up to and including the given level of turn-away indicated on the X-axis.
If immediate access is considered to be a desirable feature such as in maternity, intensive care or certain types of psychiatric care; then optimum occupancy could be said to lie somewhere near to the 0.1% turn-away line, which as Figure 1 demonstrates, relies upon an average occupancy well below 85% in all but the very largest bed pools. Note that 22% of hospitals in Michigan run at or below 0.1% turn-away while a further 29% are in the interval 0.1% to 1% turn away (See Figure 2). This is consistent with the tendency of the US health care system to offer high levels of immediate access especially where there is competition between hospitals for income. If (and only if) patients can be easily transported then regional or district bed pools can be used to gain the benefits of economy of scale and the average occupancy/turn-away relationship can be applied to the larger regional or district bed number relating to that specific type of bed provision. In England, 45% of Mental Health Trusts are operating in the >1% to <5% turn-away band and 27% operate above 20% turn away compared to only 8% in Michigan and this mat well reflect that higher capital cost constraints in the UK and pressure from the government via the Department of Health to reduce bed numbers.
Optimum Occupancy
A recent review of average occupancy in English and US acute hospitals has concluded that the ‘optimum’ whole hospital occupancy, i.e. across multiple constituent specialty bed pools, is around 72% for a 200 bed hospital, 78% for 500 and 83% at 1,000 beds (9). It has been suggested that the ‘optimum’ occupancy is a balance between care in the community and inpatient care (26). From the perspective of various community-based mental health teams the ready availability of a bed allows management of acutely ill patients to occur in a safe and appropriate setting. To have too few beds implies that the community services become over-stretched and the effectiveness and safety of their service diminishes.
An example of this balance is seen in the years between 1988 and 2008 where in England it was observed that the closure of 2 psychiatric hospital beds lead to 1 additional involuntary admission in the following year (29). Additional discussion around mental health bed provision in England has been given elsewhere (30).
However determining the optimum balance between inpatient and community care is not a simple matter and sophisticated artificial neural networks and modelling have been employed to determine this balance (31-32). These authors found that beds devoted to schizophrenia could be significantly downsized (moved to community care) while those devoted to affective disorders and borderline personality disorders were more problematic and needed to remain as inpatient care.
In the absence of such supporting technology to fully characterise the optimum balance the author suggests that in England somewhere around 3% to 5% turn-away is probably a suitable compromise. Interestingly this is very close to the figure of 2% turn-away determined by Goronescu et al (33) as the economic optimum for elderly care beds, i.e. the balance between the cost of empty beds and income lost as patients are turned-away. Although it must be pointed out that the figure of 2% turn-away was derived at a time when capital costs were generally lower, hence, the current figure of around 3% to 5% is probably more widely applicable. This implies that only the largest psychiatric units with 80 or more dedicated specialty beds should be operating at anywhere near to 85% average occupancy. Even if (for instance) the ‘optimum’ implied 20% turn-away then the ‘damage limitation’ upper limit for average occupancy of 85% will still apply.
The final consideration is around the desirability of queues. When a queue to gain entry to a bed is allowed a more complex form of the Erlang equation needs to be employed, however, the key point is that queuing allows the opportunity to run at higher average occupancy since a bed gets filled immediately from the queue. Not appreciated is the fact that performance targets such as guaranteed maximum waiting times effectively limit the size of the queue. This explains why acute hospitals in England experience frequent breaches of the guaranteed waiting time target and make recourse to nearby private hospitals to even out the volatility in the incoming demand.
Hence from a psychiatric perspective this issue revolves around the desirability or otherwise of keeping patients waiting for treatment as has been discussed above.
Seasonal and Other Cycles
The role of seasonal factors in exacerbating the acuity of mental and behavioural disorders is well recognised (34-35). The solar cycle has been suggested to lead to a long-term cycle in the disposition to certain mental health disorders (36) while the current unexpected increase in accident and emergency attendances, emergency medical admissions and all-cause mortality in the UK has been suggested to be part of a larger infectious cycle which appears to have associated mental health repercussions (37-38). Cytomegalovirus or perhaps other know infectious and psychotropic agents may well be involved (37,39-40). However, the above factors all contribute to a degree of flexibility and sometimes uncertainty in the required bed provision which suggests that it is better to err on the side of caution.
Beds and Staff
All will be aware of the argument that beds are expensive. In their own right beds and buildings are capital assets which are depreciated over many years and, as such, are not hugely expensive. Empty but fully staffed beds are the expense to be avoided. This author has argued that the key challenge from a cost efficiency perspective is to build flexibility into how staff are deployed such that it is the occupied beds (i.e. patients) which are staffed (9,25). The Erlang equation explains why this required flexibility becomes more problematic as the size of the bed pool decreases, i.e. bed occupancy becomes more volatile. The very fact that there are recognised seasonal and other cycles implies that weather and environment-based forecasting tools should be available to support the necessary flexible application of staff.
Conclusions
The Erlang equation allows an impartial evaluation of the role of occupancy and its knock-on consequences to having a bed available for the next arriving patient. The figure of 85% average occupancy is best understood in terms of damage limitation arising from running at too high a level of busyness. To determine the genuine optimum balance between community and inpatient services requires the use of sophisticated supporting tools which sadly are too infrequently employed in the context of the NHS. For those wishing to explore the usefulness of the Erlang equation the words ‘Erlang calculator’ in an Internet search engine will yield a number of suitable free to use applications. Hopefully this article has placed 85% occupancy in a wider context and provided a simple graphical tool to illustrate the linkages between size, occupancy and turn-away. Despite many years of developing community-based psychiatric services it would still appear that there are too few inpatient beds to ensure that acutely-ill patients are treated rapidly and in the correct context. The simplistic argument that cutting beds saves money is both misleading and leading to adverse or ‘never’ events.
Acknowledgements
The comments and suggested improvements provided by I Haq are recognised with gratitude.
Declaration of Interest
The author provides consultancy to health care organisations.
References
- Gunn J. Future directions for treatment in forensic psychiatry. B J Psych 2000; 176: 332-8.
- Thompson A, Shaw M, Harrison G, et al. Patterns of hospital admission for adult psychiatric illness in England: analysis of Hospital Episode Statistics data. B J Psyc. 2004; 185: 334-41.
- Bowers L, Flood C. Nurse staffing, bed numbers and the cost of acute psychiatric inpatient care in England. J Psychiatr Ment Health Nurs. 2008; 15(8): 630-7.
- Royal College of Psychiatrists (2011) Do the right thing: how to judge a good ward. College Report OP79, June 2011 http://www.rcpsych.ac.uk/usefulresources/publications/collegereports/op/op79.aspx
- McBain R, Salhi C, Morris J, et al. Disease burden and mental health system capacity: WHO Atlas study of 117 low- and middle-income countries. B J Psyc. 2012; 201: 444-50.
- Bagust A, Place M, Posnett J (1999) Dynamics of bed use in accommodating emergency admissions: stochastic simulation model. BMJ. 319: 155-8.
- Virtanen M, Vahtera J, Batty G, et al. Overcrowding in psychiatric wards and physical assaults on staff: data-linked longitudinal study. B J Psych. 2011; 198: 149-55.
- Green L. How many hospital beds? Inquiry. 2003; 39(4): 400-12.
- Jones R. Hospital bed occupancy demystified. British Journal of Healthcare Management. 2011; 17(6): 242-8.
- Forster A, Tugwell P, Van Walraven C. An hypothesis paper on practice environment and the provision of health care: Could hospital occupancy rates effect quality. Journal of Quality in Clinical Practice. 2000; 20: 69-74.
- Borg M. Bed occupancy and overcrowding as determinant factors in the incidence of MRSA infections in general ward settings. Journal of Hospital Infection. 2003; 54(4):316-8.
- Dulworth S, Pyenson B. Healthcare-associated infections and length of hospital stay in Medicare population. American Journal of Medical Quality 2004; 19(3): 121-7.
- Cunningham J, Kernohan W, Sowney R. Bed occupancy and turnover intervals as determinant factors in MRSA infections in acute settings in Northern Ireland. J Hosp Infect 2005; 61(3): 189-93.
- Cunningham J, Kernohan W, Rush T. Bed occupancy, turnover intervals and MRSA rates in English hospitals. Br J Nursing 2006; 15(12): 656-60.
- Sprivulis P, Da Silva J-A, Jacobs I, Frazer A, Jelinek G. The association between hospital overcrowding and mortality among patients admitted via Western Australia emergency departments. Medical Journal of Australia 2006; 184(5): 208-12.
- Clements A, Halton K, Graves N, Pettitt A, Morton P, et al. Overcrowding and understaffing in modern health-care systems: key determinants in meticillin-resistant Staphylococcus aureus transmission. Lancet Infectious Diseases. 2008; 8(7): 427-34.
- Gidney G. Infection control: A tool for sustainable hospital design. University of Cambridge IDBE 12 Thesis, 2008. www.idbe.org/uploads/Gidney%Thesis%FINAL.pdf
- Virtanen M, Pentti J, Vahtera J, Ferries J, Stansfield S et al. Overcrowding in hospital wards as a predictor of antidepressant treatment among hospital staff. Am J Psychiatry. 2008; 165: 1482-6.
- Schilling P, Campbell D, Englesbe M, Davis M. A comparison of in-hospital mortality risk conferred by high hospital occupancy, differences in nurse staffing levels, weekend admission, and seasonal influenza. Medical Care. 2010; 48(3): 224-32.
- Boyle J, Zeitz K, Hoffman R, Khanna S, Beltrame J. Probability of severe adverse events as a function of hospital occupancy. IEEE Journal of Biomedical and Health Informatics. 2013; 10.1109/JBHI.2013.2262053
- Kaier K, Mutters N, Frank U. Bed occupancy rates and hospital-acquired infections – should beds be kept empty. Clinical Microbiology & Infection. 2012; 18: 941-5.
- Jones R. A simple guide to a complex problem – maternity bed occupancy. British Journal of Midwifery. 2012; 20(5): 351-7.
- Bain C, Taylor P, McDonnell G, Georgiou A. Myths of ideal hospital occupancy. Med J Aust. 2010; 192: 42-3.
- Jones R. Myths of ideal hospital size. Med J Aust. 2010; 193(5): 298-300.
- Marjot D. Estimating hospital bed numbers. The Psychiatrist. 1987; 11: 432-4.
- Jones R. Hospital bed occupancy – don’t take it lying down. Health Service Journal. 2002; 112(3456): 23-4.
- De Bruin A, Bekker R, van Zanten L, Koole G. Dimensioning hospital wards using the Erlang loss model. Ann Oper Res. 2010; 178: 23-43.
- Williams M, Allen M, Fordyce A, Karakusevic S. Does a specialty ward structure remain a sustainable approach to meet the volatility, increasing demand and safety requirements for inpatient hospital treatment. 26th Australian and New Zealand Academy of Management (ANZAM) Conference 2012
- Keown P, Weich S, Bhui K, Scott J. Association between provision of mental illness beds and rate of involuntary admissions in the NHS in England 1988 – 2008: ecological study. BMJ. 2011; 343: d3736.
- Green B. The decline of inpatient psychiatry in England. General Practice Online. 2013. Available online at: http://www.priory.com/psychiatry/Decline_NHS_Inpatient_Psychiatry.htm
- Davis G, Lowell W, Davis G. Determining the number of state psychiatric hospital beds by measuring quality of care with artificial neural networks. American Journal of Medical Quality. 1998; 13(1): 13-23.
- Davis G, Lowell W. Using artificial neural networks and the Gutenberg-Richter Power Law to “rightsize” a behavioural health care system. American Journal of Medical Quality. 1999; 14(5): 216-28.
- Gorunescu F, McClean S, Millard P. A queuing model for bed-occupancy management and planning of hospitals. Journal of the Operational Research Society. 2002; 53: 19–24.
- Licanin I, Fisekovic S, Babic S. Admission rate of patients with most common psychiatric disorders in relation to seasons and climatic factors during 2010/11. Mat Soc Med. 2012; 24(2): 94-9.
- Singh G, Charan B, Arun P, Sidana A. Seasonal pattern of psychiatry service utilization in a tertiary care hospital. Indian J Psych. 2007; 49(2): 91-5.
- Davis G, Lowell W. Chaotic solar cycles modulate the incidence and severity of mental illness. Medical Hypotheses. 2004; 62, 207-14.
- Jones R. Could cytomegalovirus be causing widespread outbreaks of chronic poor health. In Hypotheses in Clinical Medicine (Eds M Shoja et al): 37 -79. Nova Science Publishers Inc, New York., 2013.
- Jones R. An unexplained increase in deaths in England and Wales during 2012. British Journal of Healthcare Management. 2013; 19(5): 248-53.
- Borglum A, Demontis D, Grove J, Pallesen J, Hollegaard M, Pedersen C, et al. Genome-wide association and interaction with maternal cytomegalovirus infection suggests new schizophrenia loci. Molecular Psychiatry. 2013; 1-9
- Jones R. Do recurring outbreaks of a type of infectious immune impairment trigger cyclic changes in the gender ratio at birth? Biomedicine International. 2013; 4(1) in press
Copyright Priory Lodge Education Ltd. 2013 -
First Published July 2013
priory Useful links
Click
on these links to visit our Journals:
Psychiatry
On-Line
Dentistry On-Line | Vet
On-Line | Chest Medicine
On-Line
GP
On-Line | Pharmacy
On-Line | Anaesthesia
On-Line | Medicine
On-Line
Family Medical
Practice On-Line
Home • Journals • Search • Rules for Authors • Submit a Paper • Sponsor us
All pages in this site copyright ©Priory Lodge Education Ltd 1994-


