THE EFFECT OF LUTING AGENT
ON THE FRACTURE RESISTANCE OF
ALL-CERAMIC CROWNS
References and Appendix
![]()
![]()

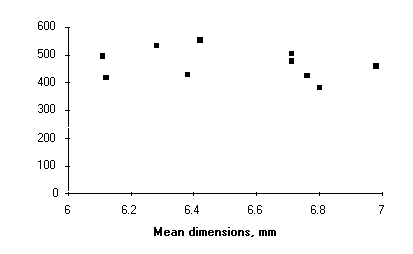
Fig.23: Graphic presentation of the relationship between Fracture load (N) and Mean dimensions of group 1of prepared teeth

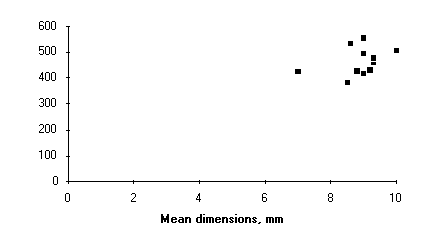
Fig.24: Graphic presentation of the relationship between Fracture load (N) and mean dimensions of Group 1of Empress crowns.

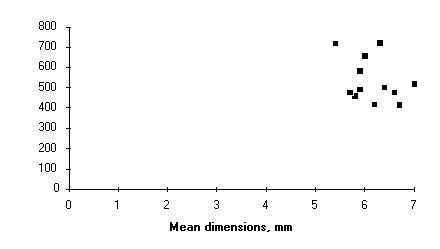
Fig.25: Graphic presentation of the relationship between Fracture load (N) and Mean dimensions of Group 3 of prepared teeth.

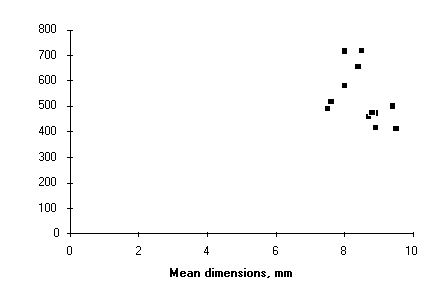
Fig.26: Graphic presentation of the relationship between Fracture load (N) and Mean dimensions of the Group 3 of Empress crowns.33
![]()